The Pattern Spectrum
The pattern spectrum (PS), also referred to as the pecstrum, gives a histogram of the distribution of the sizes of various objects comprising an image. The parameters distilled from this spectrum allow us to perform a quantitative analysis of the content in the image.
The pecstrum is created as follows:
- Take an opening of the image with an appropriate structuring element;
- Distract this opening from the original image. This difference image is the n-th element of the so called Distance Size Transformation (DST);
- In a binary image: count the number of object pixels; in a grayscale image: sum all the gray values;
- Put this number in the n-th bin of the pattern spectrum (start with n = 0);
- Repeat steps 1 through 4 with the opened image as the new original (n increases
with one);
Important: remember that the opening is idempotent. In the next cycle we need to take another structuring element. Take nB, this means that the past structuring element dilated with the original one is the new structuring element. This way the small objects will be filtered out first, and with increasing n the bigger objects will disappear. - In a binary image: stop when the image is empty; in a grayscale image: stop when the image is flat.
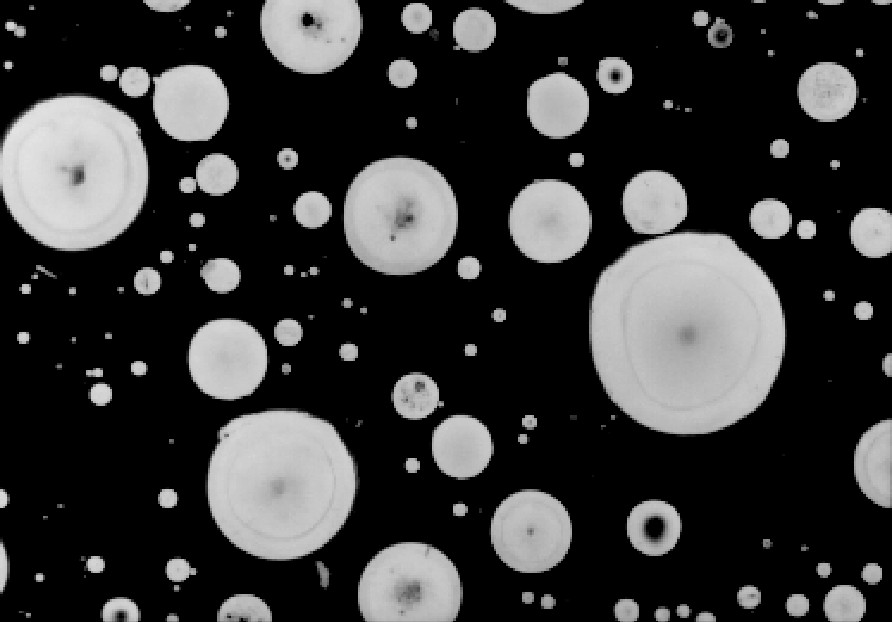
An example:
The first figure is our original image. Because the present objects have a
circular shape, we choose a disk shaped structuring element. We start with
a disk with radius five, but the radius will increase with increasing n-value.
The other eight figures
show the residues after opening with structuring element (n-1)B.
This residue will be used in the next cycle for opening with nB.
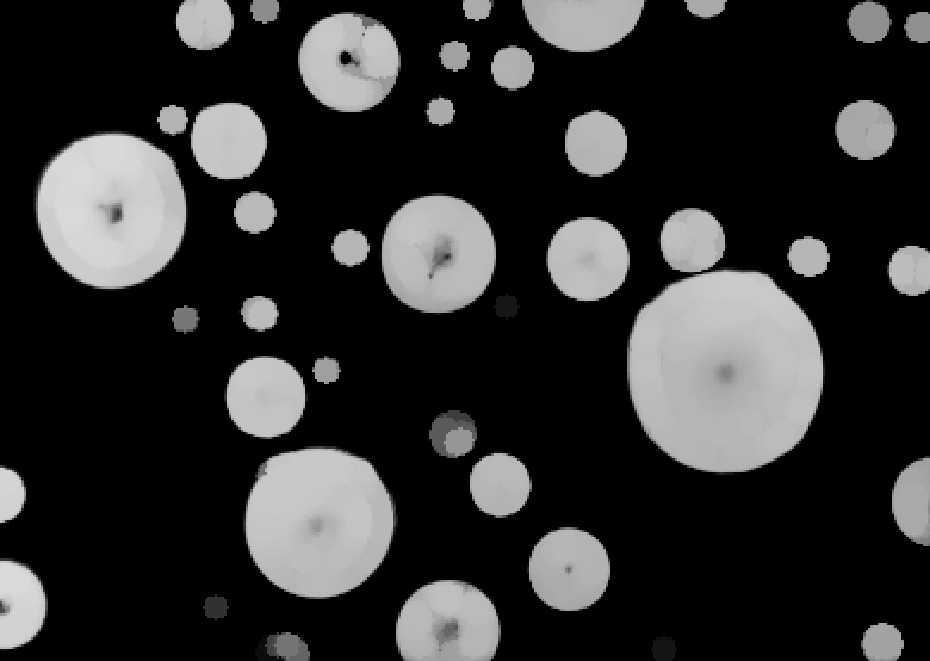
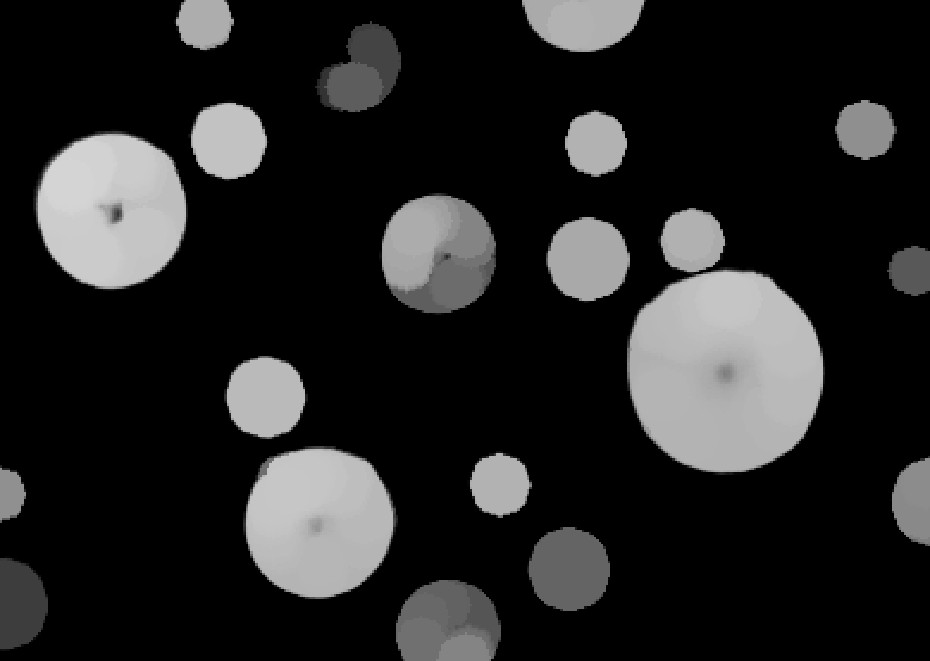


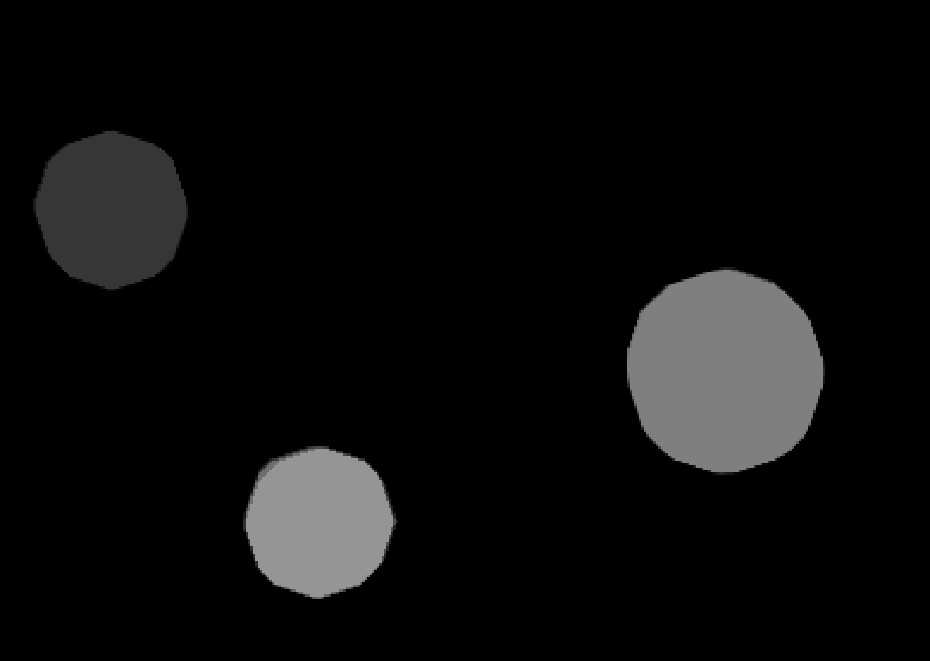


You can clearly see that first all the small objects are filtered out of the image, while the big objects remain in the residue until the end.
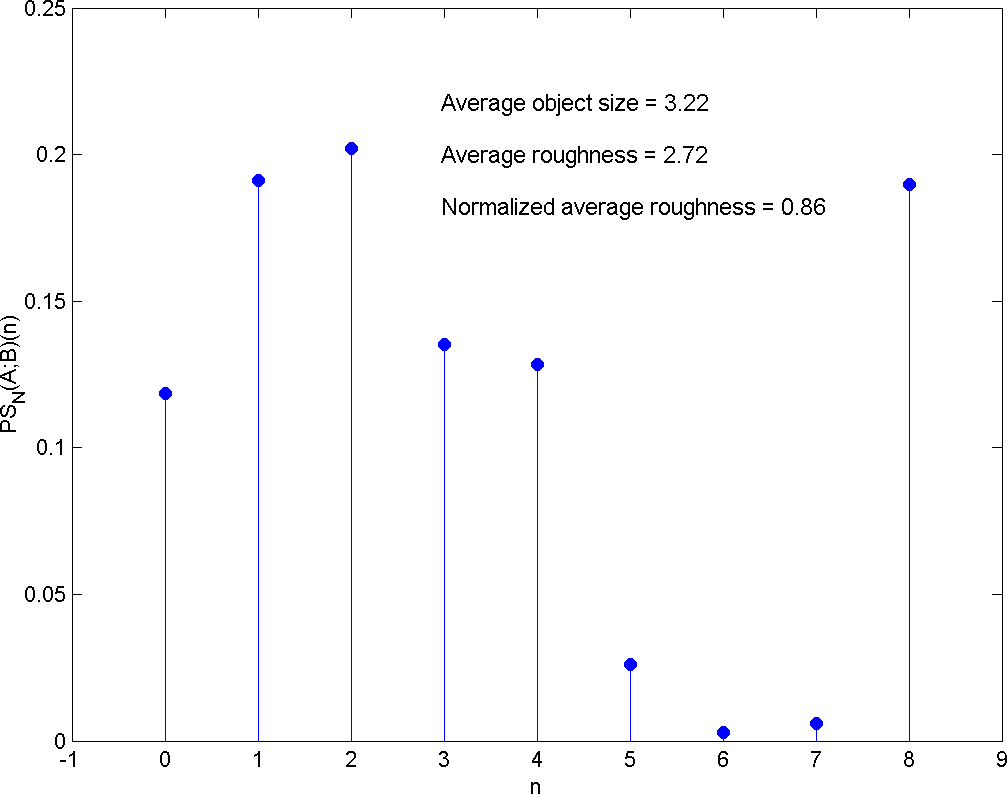
The pattern spectrum that results from this procedure can be seen below. The
pecstrum has been normalized (according to the area of the structuring element).
Some parameters can be extracted from such a spectrum, like the average
size and the average roughness (entropy, tells something
about the variation of different sizes in the image). These parameters could
be used for classification.